Project Results
MnModel's predictive power has improved through the successive phases of the project. These improvements have been achieved by better data and refined modeling procedures.
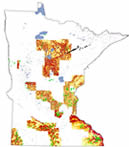
Phase 1Phase 1 models (1996) were developed for only 27 counties. They predict sites 22-54 percent better than by random chance alone.
Phase 1 site probability model.
|
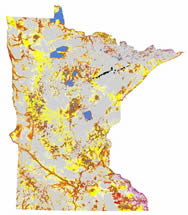
Phase 2Phase 2 models (1997) were the first models developed for the entire state. They predict sites 28-89 percent better than by random chance alone.
Phase 2 site probability model.
|
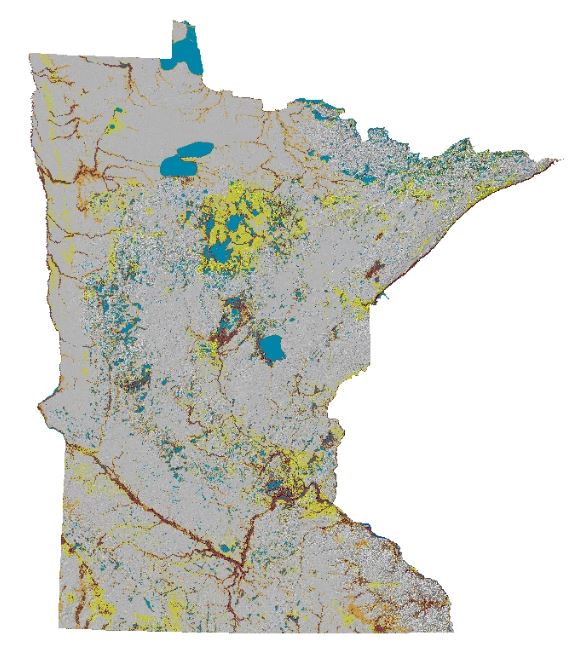
Phase 3Phase 3 models (1998) predicted sites 44-90 percent better than by random chance alone. Twenty-three percent of the state was classified as high or medium site potential. The Phase 3 Survey Implementation Model was the first to indicate areas where potential for sites is unknown because of inadequate survey information.
Phase 3 site probability model.
|
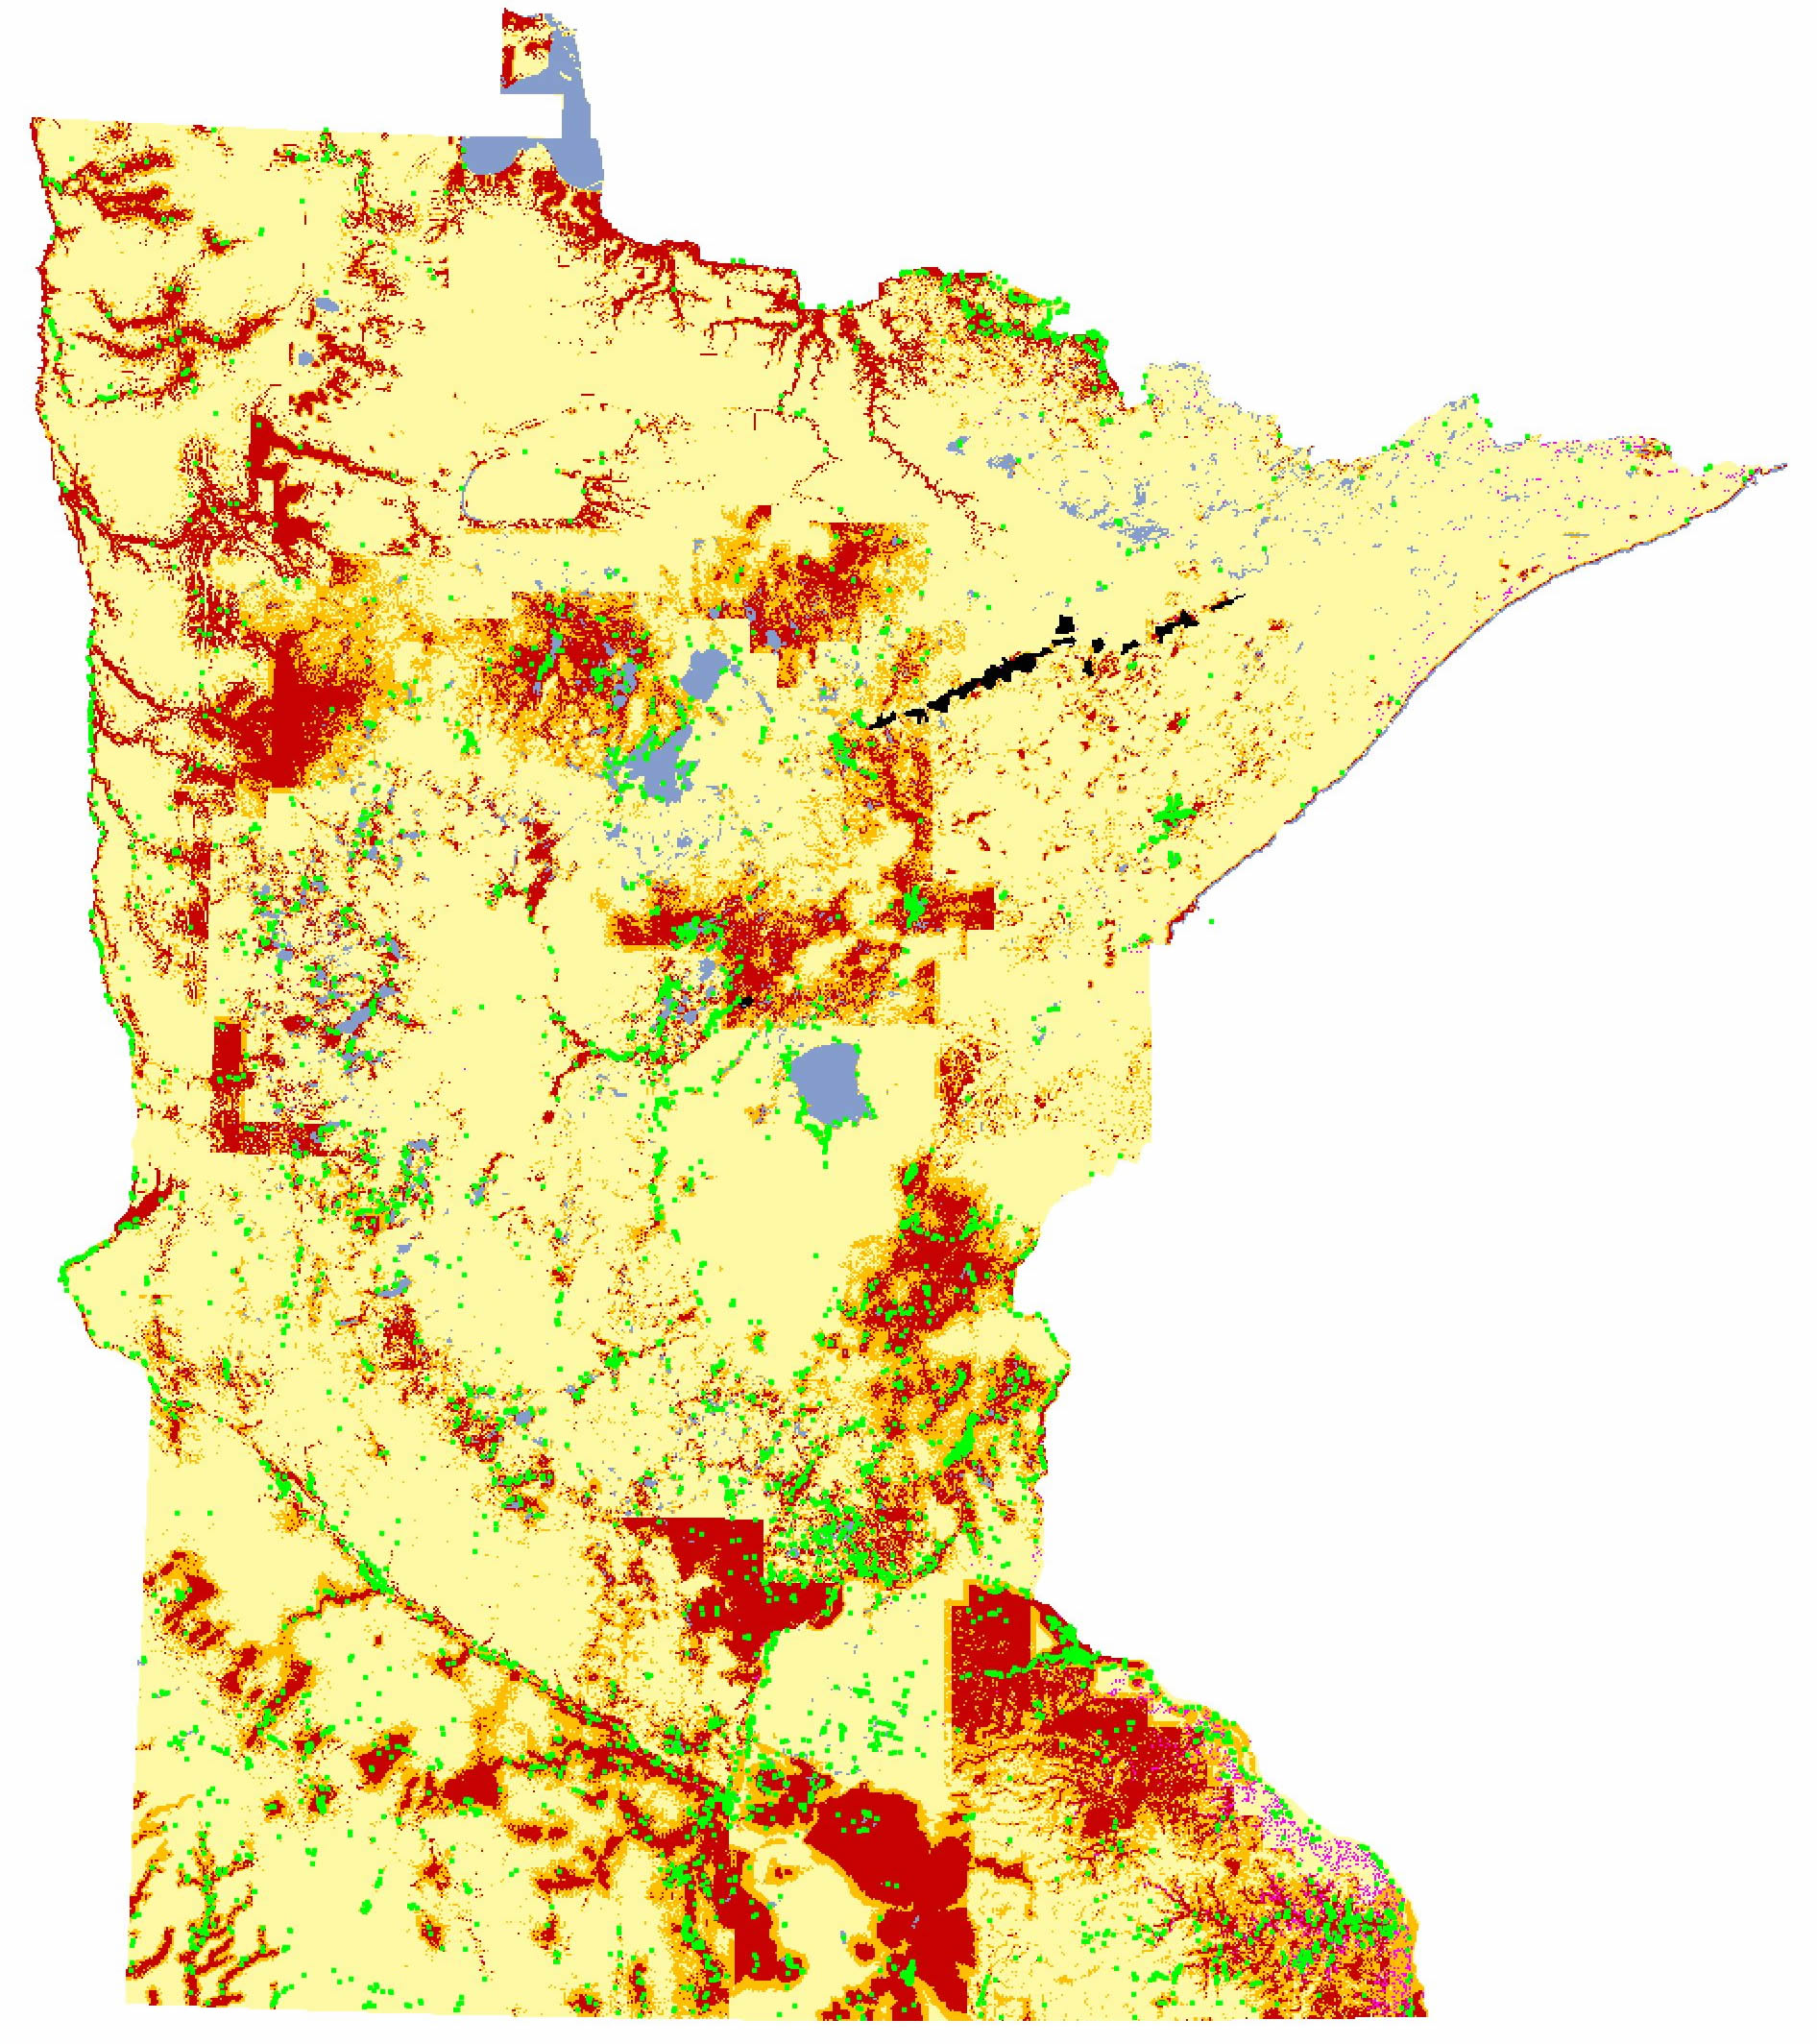
Phase 4Phase 4 models (2019) predict sites 78-96 percent better than by chance alone. Only 13 percent of the state is classified as high site potential.
Phase 4 site probability model.
|